
Effect of Light Intensity
on the Rate of Photosynthesis
Light intensity is one of the factors affecting the rate of photosynthesis. Other factors are concentration of carbon dioxide, temperature and to a lesser degree, water. Light intensity directly affects the light-dependent reaction in photosynthesis and indirectly affects the light-independent reaction.
Light is a limiting factor when the light intensity is too low to allow the light-dependent reaction to proceed at its maximum rate. Light is not normally a limiting factor except for plants in forest understory of other shaded plants. Veryhigh light intensities may slow the rate of photosynthesis due to bleaching of chlorophyll. However, plants exposed to such conditions usually have protective features to include thick, waxy cuticles and hairy leaves.
Measuring the rate of oxygen evolution using a water plant is commonly used to measure the rate of photosynthesis. Oxygen is a gaseous product, so can be measured by noting volume changes of the number of bubbles evolved (less accurate).
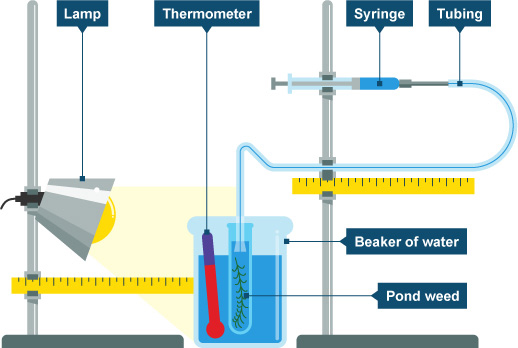
Apparatus and Materials
 |
Procedure
1. Cut the stem of a bubbling pond weed which has been well illuminated to about 5cm. Place the cut surface upwards in a test tube containing sodium hydrogencarbonate solution.
2. Place the test tube in the beaker of water andnote the temperature. The beaker of water acts as a heat filter or heat shield, so its temperature should be checked at intervals to ensure that it is constant throughout the experiment; the water should be renewed if necessary.
3. Attach the gas-collecting apparatus, if any.
4. Darken the laboratory by turning off as many lights as possible.
5. Place lamp 10 cm away from the beaker. Allow the plant to equilibrate or adjust to the light intensity for 2-3 minutes
When the rate of air bubbles is regular and a adequate (>10 bubbles/minute), place the capillary tube/test tube over the cut tip of the pondweed and then measure the volume. OR,count the number of bubbles. This should be done for 5 minutes. Repeat twice and obtain an average of the results.
6. Repeat steps 4 and 5, with increasing distances away from the light source e.g. 20 cm, 30 cm, 40 cm and 50 cm. Light intensity is a inversely proportional to the square of the distance, so as the distance is increased the light intensity decreases. Note that doubling the the distance does not half the intensity, rather quarters it.
7. Record results in a table, then plot a graph of volume of oxygen/minute OR number of bubble/minute against the distance between the lamp and the plant.
Observation/Results
As light intensity increases (distance between lamp and plant decreases) the volume of oxygen (or the rate of bubble production) increases. This indicates that the rate of photosynthesis increases with light intensity.
However, at sufficiently high levels of light intensity, the rate oxygen evolution remains constant.
Use the Waterweed Simulator to manipulate the light intensity, wavelength and carbon dioxide and see their effect on the rate of photosynthesis.
However, at sufficiently high levels of light intensity, the rate oxygen evolution remains constant.
Use the Waterweed Simulator to manipulate the light intensity, wavelength and carbon dioxide and see their effect on the rate of photosynthesis.
Discussion
1. Why is sodium hydrogen carbonate solution used instead of water?
Sodium hydrogencarbonate increases carbon dioxide availability, and ensures that carbon dioxide is not a limiting factor for the the reaction. Plain water water may not contain enough oxygen so that the maximum rate of photosynthesis can occur.
Ideally, pondwater should be used to make up the sodium hydrogencarbonate solution. Tap water may be used to make the solution, but only after it has been left to stand overnight, so that it chlorine content is reduced. Chlorine tends to inhibit the rate of photosynthesis.
2. In some cases, a trace of detergent is also added to the water in the test tube. Explain why.
Detergent may be added to reduce surface tension. This will allow bubbles to escape freely.When surface tension is high, bubbles are of varied sizes.
3. Suggest how this procedure can be modified so that the distance between the lamp and the plant is not varied.
The power of the lamp may be varied e.g. use of 20W, 40W, 60W and 100W bulbs. 4. Why was the laboratory darkened? The laboratory was darkened to reduce light from other sources, to ensure that the light intensity was mainly due to the lamp. |
5. What are the main sources of inaccuracy in the experiment?
When counting bubbles, the bubbles may be of varied sizes, leading to inaccurate conclusions about the rate of oxygen production. If the rate of bubbling is very high, then there may be errors in counting. Another source of inaccuracy is the presence of other light sources, of which intensities may be varied by shifting shadows.
5. How can we prove that oxygen was the gas produced?
A glowing splint should be placed near the mouth of the test tube, where the gas was collected.If oxygen is present the splint is re-ignited into a flame.
6. If the gas which was produced was analyzed and found not to be pure oxygen, how would you account for this?
Water contains other dissolved gases which came out of solution and mixed with the oxygen.Carbon dioxide is expected in this mixture, particularly if sodium hydrogen carbonate was used.
7. What is the relationship between the light intensity and the rate of photosynthesis at low light intensities?
At low light intensities, the rate of photosynthesis increases with the intensity; the rate is directly proportional to intensity ( but inversely proportional to distance)
8. Why does the rate of photosynthesis not increase at very high light intensities?
At very high light intensities, the rate of photosynthesis levels off or remains constant. At this point, another factor - other than light - contributing to the rate of photosynthesis is limiting. The most likely reason for the leveling off of the reaction rate is the saturation of active sites in the enzymes catalyzing the reactions.
In the case of this experiment - the limiting factors are unlikely to be water or carbon dioxide. A limiting factor may be temperature - a slight increase in the ambient temperature mayresult an increase in the rate of reaction. However, a high temperatures the enzymes catalyzing the photosynthetic reactions would be denatured.
Comments
Post a Comment